Migration Watch UK
9 March, 2015
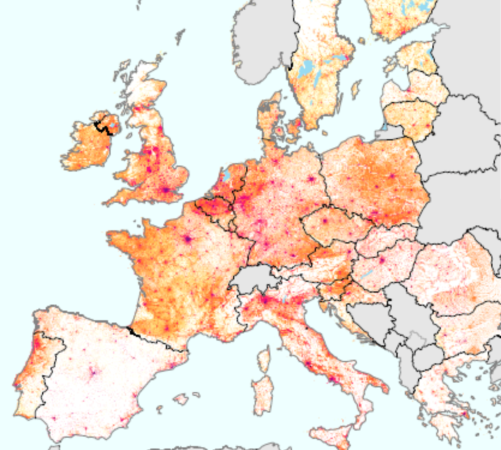
This brief compares population density in European countries and looks at the likely trend in that density given projected population growth up to 2080. The UK, and England in particular, is one of the most densely populated parts of Europe. In the map below (Figure 1), the highest density areas are coloured red. Of all major countries, the UK has a particularly high concentration of such high density areas, mostly in England. That concentration is surpassed elsewhere only in Belgium and The Netherlands. The lower population density of most of Germany, of France, and especially of Spain, is apparent.
The data on population and density in Figures 1 and 2 come from Eurostat. The projection data in Figure 3 combine the EUROPOP 2013 based population projections with geographical data from the World Bank, which correspond very closely with that used by Eurostat. These area data exclude large bodies of inland water, which in this selection of countries affects primarily The Netherlands.
Figure 1 Population density, EU countries 2012.
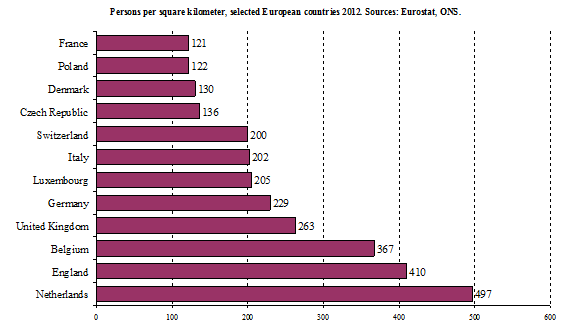
Inspection of the data shows that of the larger countries, The Netherlands (497 persons per square kilometer) and Belgium (367) hold first and second place in respect of population density, with the United Kingdom coming third (Figure 2). Smaller countries such as Malta (far and away the most densely populated country) are excluded from this comparison. If England (not of course a ‘country’) were included in this comparison it would rank second (410).
This rank order will not endure, as these countries have different rates of population growth and their population size is projected to diverge in various ways throughout the century, re-arranging the rank-order in Figure 2.
Figure 2. Persons per square kilometre, larger EU countries 2012. Source: Eurostat.
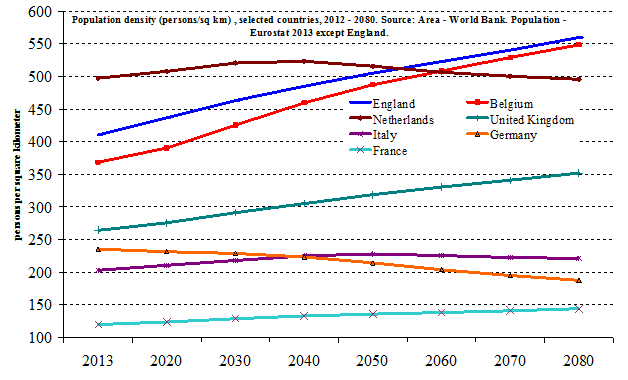
The projected population density of some of these countries is shown in Figure 3 below. The population projections behind the calculation are those of the medium variant of the Eurostat 2013 projections. The land area is of course assumed to be constant. The projection for England is based upon the ONS 2012 Principal Projection. Eurostat does not provide a projection for England. However its projection for the UK up to 2080 is almost identical to the ONS 2012 PP for the UK. It should be noted that the projections by the ONS are for the years 2021, 2031 etc. not 2020, 2030 as for the Eurostat projections. Projections up to 2080 are , of course, highly adventurous and assume constancy in vital rates and net migration. The last is the most important component and the least easy to project.
According to these projections, England becomes the most highly densely populated ‘country’ among the larger countries of the EU by about mid-century, as future population growth in The Netherlands is projected to be modest. The Belgian rate of growth, and increase in population density, almost equals that of England. UK population density also grows rapidly and that of France increases progressively although from a much lower level. Population density in Germany is projected to fall throughout the period as its population falls, although at the moment, the population of Germany is actually increasing thanks mostly to high immigration from more distressed parts of the EU and the Eurozone. Population density in Italy rises then falls as the population of Italy is more or less sustained by high net immigration. On the Eurostat projections, the UK population size overtakes that of France by 2030 (they are close to begin with) and overtakes that of Germany some time between 2040 and 2050. In respect of the UK and England, these projections assume the continued failure, or the abandonment, of attempts to moderate net migration into the UK.
Figure 3. Projected population density, selected EU countries 2012-2080. Sources; Eurostat, ONS.
References
EUROPOP 2013 based population projections medium variant.
World Bank World Development Indicators Land Area (sq.km) AG.LND.TOTL.K2
See also UN estimates for all countries 1960 – 2013 using World Bank geographical data http://data.un.org/Data.aspx?d=WDI&f=Indicator_Code%3AAG.SRF.TOTL.K2