Migration Watch UK

26 November, 2014
Summary
Note: The calculation in this paper has been updated for the period 2001-2016 in our August 2018 paper, 'Impact of immigration UK population growth'. This research estimates that 82% of UK population growth between 2001 and 2016 was due to the arrival of migrants, their children and their subsequent children born in the UK.
1. The impact of immigration on the size of the UK population is substantially greater than is generally realised. Between 2001 and 2012 inclusive, 57% of population growth has been described as due to net migration, 43% to natural increase (the excess of births over deaths). However, that substantially understates the demographic power of migration. Much of that natural increase came from immigrant parents. If that immigrant contribution to natural increase is included, then the total contribution of migration to UK population growth over the period from 2001 to 2012 was between 83% and 85%.[1]
2. As for the future, the latest (2012-based) official population projections from the Office for National Statistics (ONS) show the UK population increasing from 63.7 million people in 2012 to reach 73.3 million by 2037, an increase of nearly 10 million or 15%.[2] Immigrants arriving after 2012 are projected to contribute 43% of this increase, with another 17% due to the children of those future immigrants. However, this total contribution to future population growth of 60% takes no account of the future children of migrants who were already resident in the UK before 2012. Taking into account the existing contribution described above the actual proportion of UK growth from immigrants and their children would be much higher. Unless net migration falls substantially, the figures for the next decade are likely to be very similar to the last decade, indeed higher. In the long term, on the assumptions of the official Principal Projection, all UK annual population increase after 2041 would be due to immigration even if only post-2012 immigrants and their children are included.
Introduction
3. The future size of any population depends on mortality, the birth rate and net migration. When making projections, assumptions have to be made about all three but, for the UK in most recent years, net migration has been the largest factor in population growth. This paper examines each in turn.
Mortality
4. Life expectancy has increased steadily since the 1970s, as shown in the graph below. The high and low life expectancy variant projections prepared by the ONS do not have a significant impact on the future population totals. They would increase (or reduce) the ONS Principal Projection by only about 0.7 million over the 25 year period to 2035.
Actual and projected period expectation of life at birth according to mortality rates for given year, 1981–2087, United Kingdom:
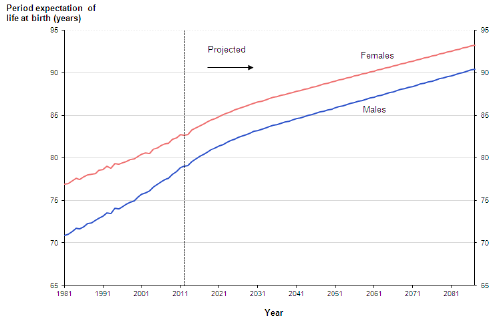
Source: ONS 2014 Chapter 4: Mortality, 2012-based NPP
Reference Volume, Figure 4.6.
http://www.ons.gov.uk/ons/dcp171776_355188.pdf
Birth Rate
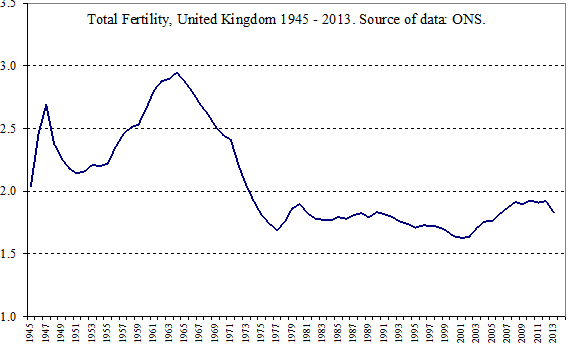
5. The birth rate was volatile in the post-war period up to the early 1970s, as show in the graph below. Since the mid 1970s it has varied much less. The Total Fertility Rate (TFR) is the most commonly used measure of fertility. It shows the average number of children per woman if the fertility patterns of any given year were to continue over her reproductive years. After a relatively flat period since 1980, there has been an upturn from 2002 to 2012. This is mostly because the long trend towards the postponement of births has eased, and women in older ages have been having children postponed earlier. Furthermore, as immigration has increased immigrant women have also contributed to the higher fertility rate since they tend to have more children, although their higher birth rates are tending to diminish. The dip in 2013 is likely to be a response to recent economic difficulties.
Immigration
6. Since 1998 immigration has become, directly and indirectly, the largest contributor to population growth. The impact of immigration is both direct in terms of new arrivals and indirect due to their children born in the UK. The latest 2012 based ONS Principal Projection of population attributed 43% of the projected increase from 2012 to 2037 to new arrivals and 17% to their children – a total of 60%. These estimates were based on a net migration assumption of 165,000 a year. Obviously, if net migration were to be higher, this percentage would also be higher. In 2013, the net inflow was 212,000 and the annual average of the last ten years (2004 – 2013) has been about 240,000.
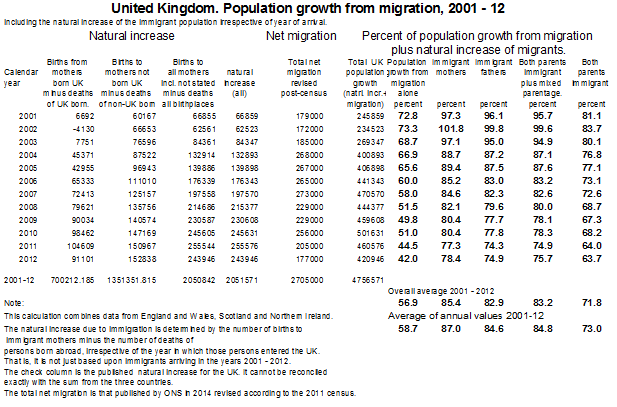
7. However, this calculation only includes future migrants and their (future) children. It does not take account of the children of migrants who have already arrived. (In this context we define migrants as those who were born outside the UK). It is possible to estimate the contribution to growth of the children of migrants in current and previous years. The size of net migration each year is known. The natural increase of people born in the UK (births minus deaths) each year can also be determined, as can the natural increase from the births to immigrant mothers and fathers minus deaths to migrants in each year, irrespective of their year of arrival (that is, not just those who arrived between 2001 and 2012).
8. Annex A illustrates such calculations which show the contribution of migration to UK population from 2001 to 2012, taking into account both net migration (direct) and the natural increase from children born to migrants in the UK (indirect). Most published statistics on births to migrants in the UK define them on the basis of births to immigrant mothers. On that basis migration has contributed, directly and indirectly, 85% of overall UK population growth from 2001-2012, or 87% based on the average of the annual values. .
9. However many of these mothers have a partner born in the UK, so this calculation overstates the contribution of migration to UK population growth - such births should only be regarded as making a 50% contribution to UK population growth. However, births to immigrant fathers who have UK-born partners must also be considered, otherwise the contribution of migration to population growth will be understated to a similar degree.
10. As the table in Annex A shows, net migration together with the natural increase from immigrant fathers contributes 83% of UK population growth 2001-2013. This is slightly lower that the result based on births to immigrant mothers because birthplace is not recorded for a substantial number of fathers, although it is not recorded only for a negligible number of mothers.
11. A calculation taking both of these contributions into account combines the natural increase from births both of whose parents were born outside the UK, together with one half of that from immigrant fathers and UK born mothers, and one half of that from immigrant mothers and UK-born fathers. On that basis, which slightly understates the effect, 83% of UK population growth from 2001 – 2012 was due to the direct and indirect effects of international migration. The UK population increased by 4.7 million people between 2001 and 2012, so net migration and the natural increase of migrants living in the UK accounted for at least 3.9 million of that total.
The longer term
12. As noted above, a projection of the total contribution of immigration to future population growth should include the contribution of the children of migrants who had already arrived before the beginning of the projection as well as future migrants and their children (the ONS projections do not do that).
13. Another way to look at the long term effect of immigration is to note that the birth rate (strictly speaking, ‘total fertility’) in the UK is currently 1.83. However, as the birth rate required to sustain a population is approximately 2.1, any long term population increase in the UK can only be as a result of immigration. This is illustrated by the graph below, using data from the ONS, which shows the development of the UK population if there were no migration at all, and if fertility remains constant and mortality continues to decline. The population continues to grow at a diminishing rate for quite a long time– until about 2041 - under the momentum of the age-structure and from longer survival, before gradually declining. On ONS assumptions (but without migration) it would return to its present size towards the end of the century. By contrast, the current ONS Principal Projection (which includes a net migration assumption of only 165,000) would give a UK population of 90 million at the end of the century.
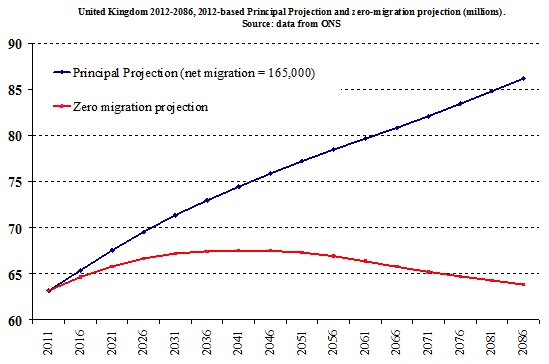
14. So with no migration at all, the zero net migration projection from the ONS shows that our population would continue to grow for the next three decades and then decline gradually, returning to the current level towards the end of the century. A comparison with the ONS 2012 Principal Projection shows that migrants arriving in the UK from 2012 onwards and their children born after that date would contribute 45% of annual projected population growth in 2016, 63% in 2026 and all growth after 2041. That takes no account of the very high proportion of UK population growth already accounted for by migration and from the children of immigrants already in the UK. On those assumptions, it is clear that all or almost all UK population growth in the longer term would arise from immigration, directly or indirectly.
Annex A